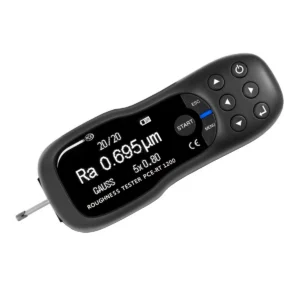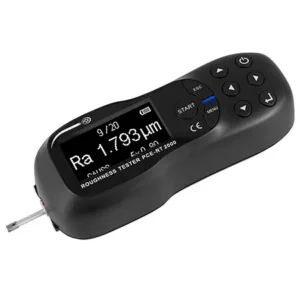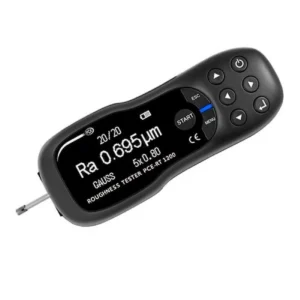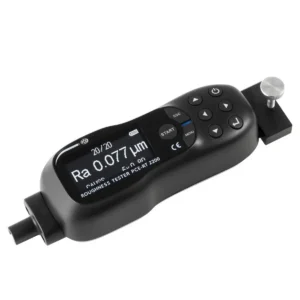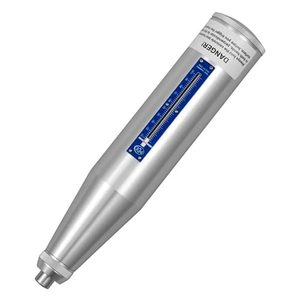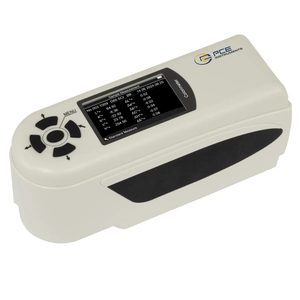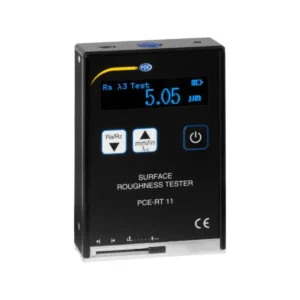

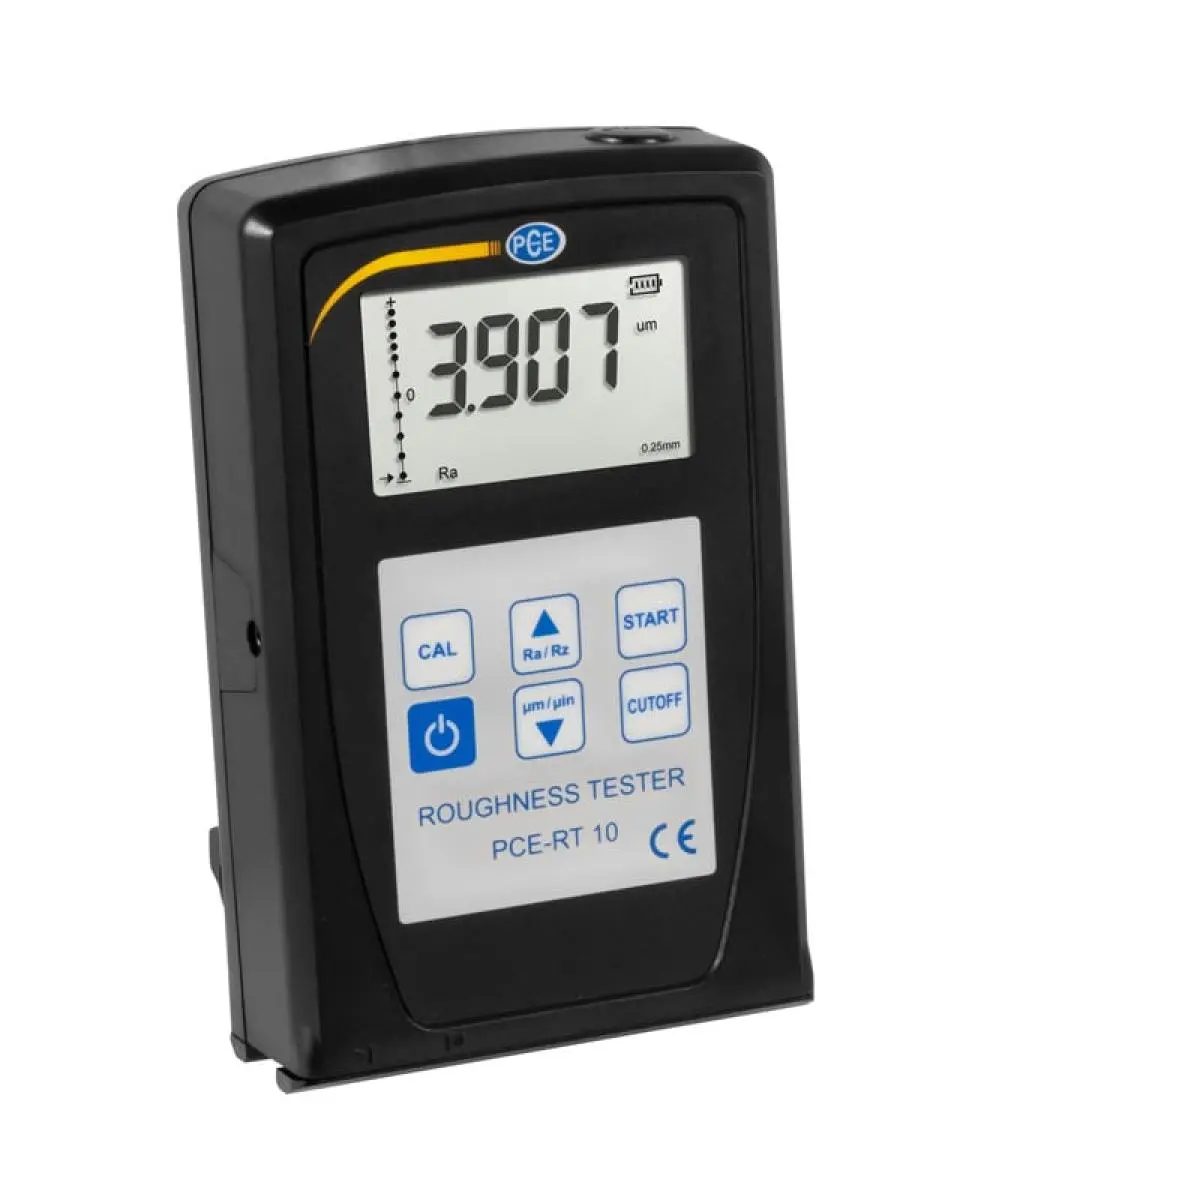
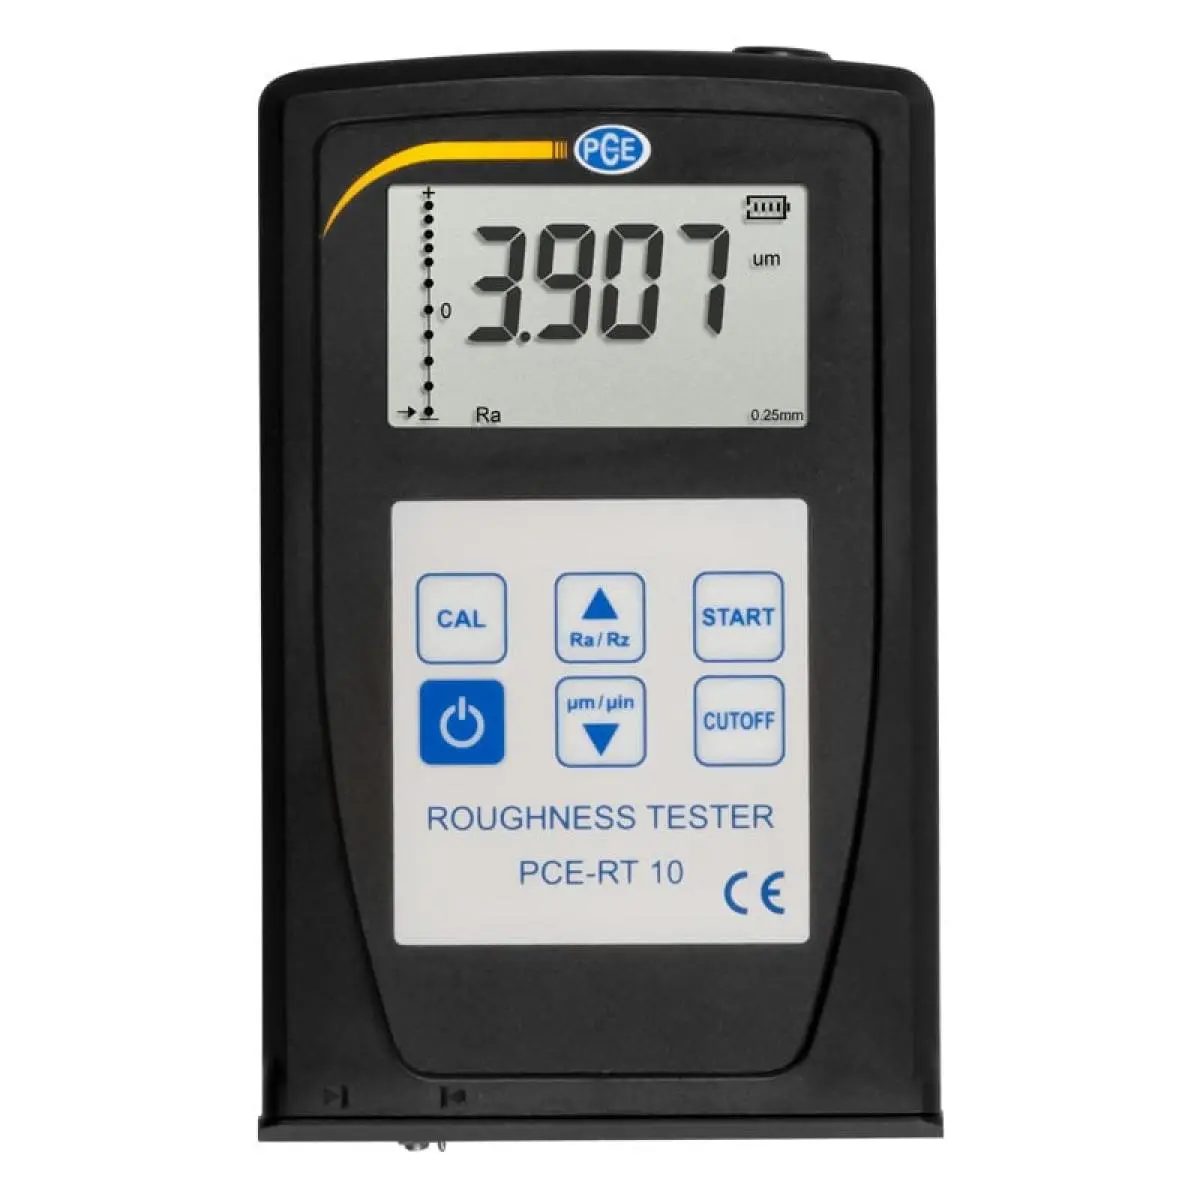
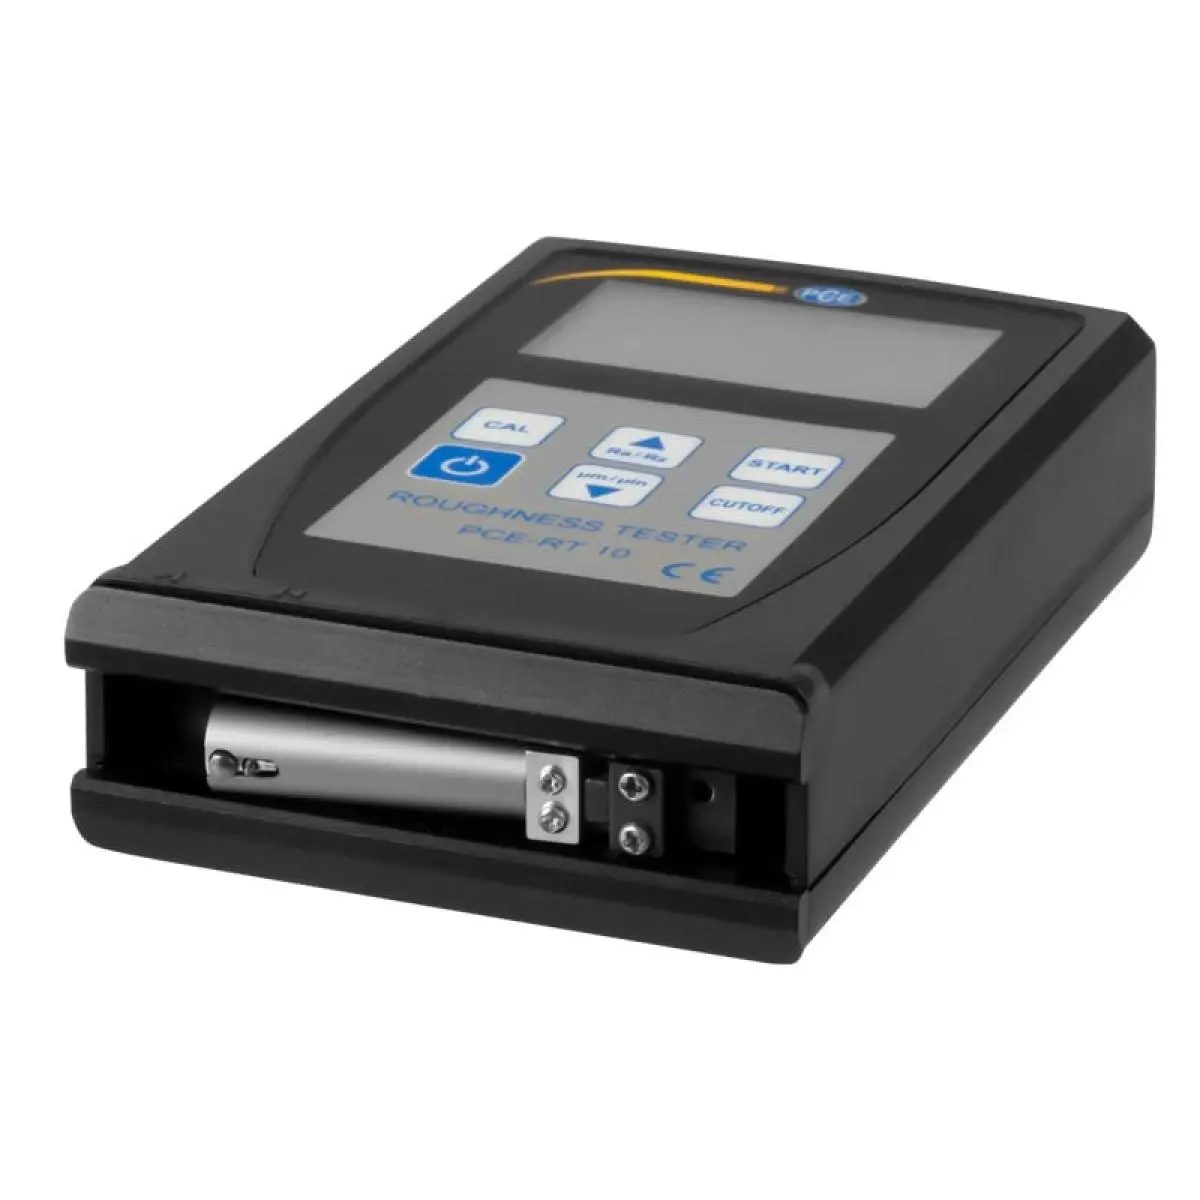
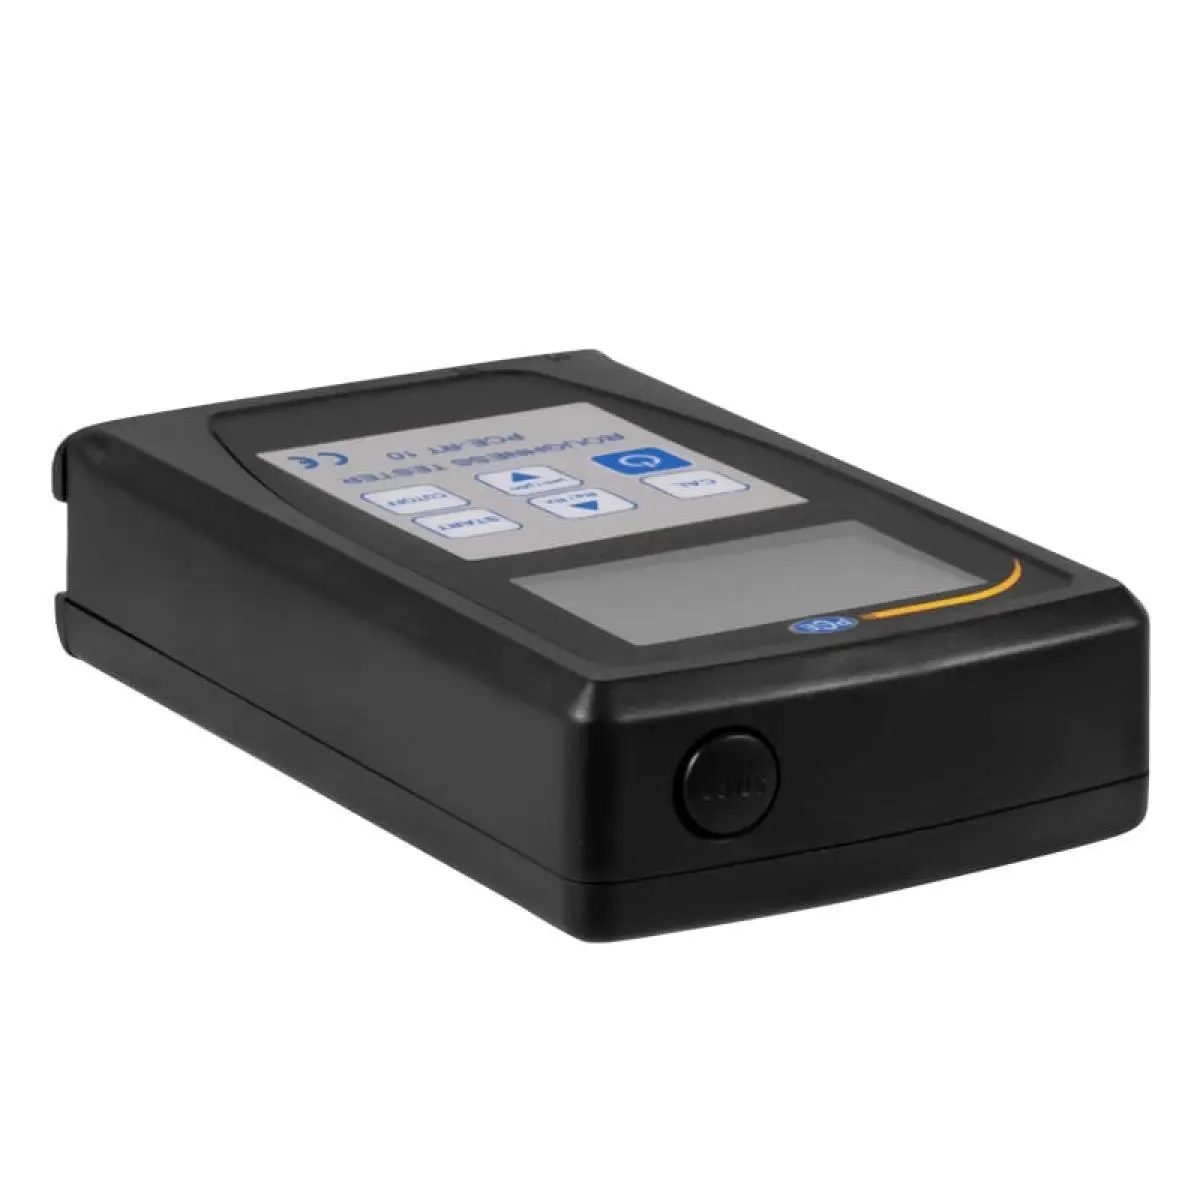
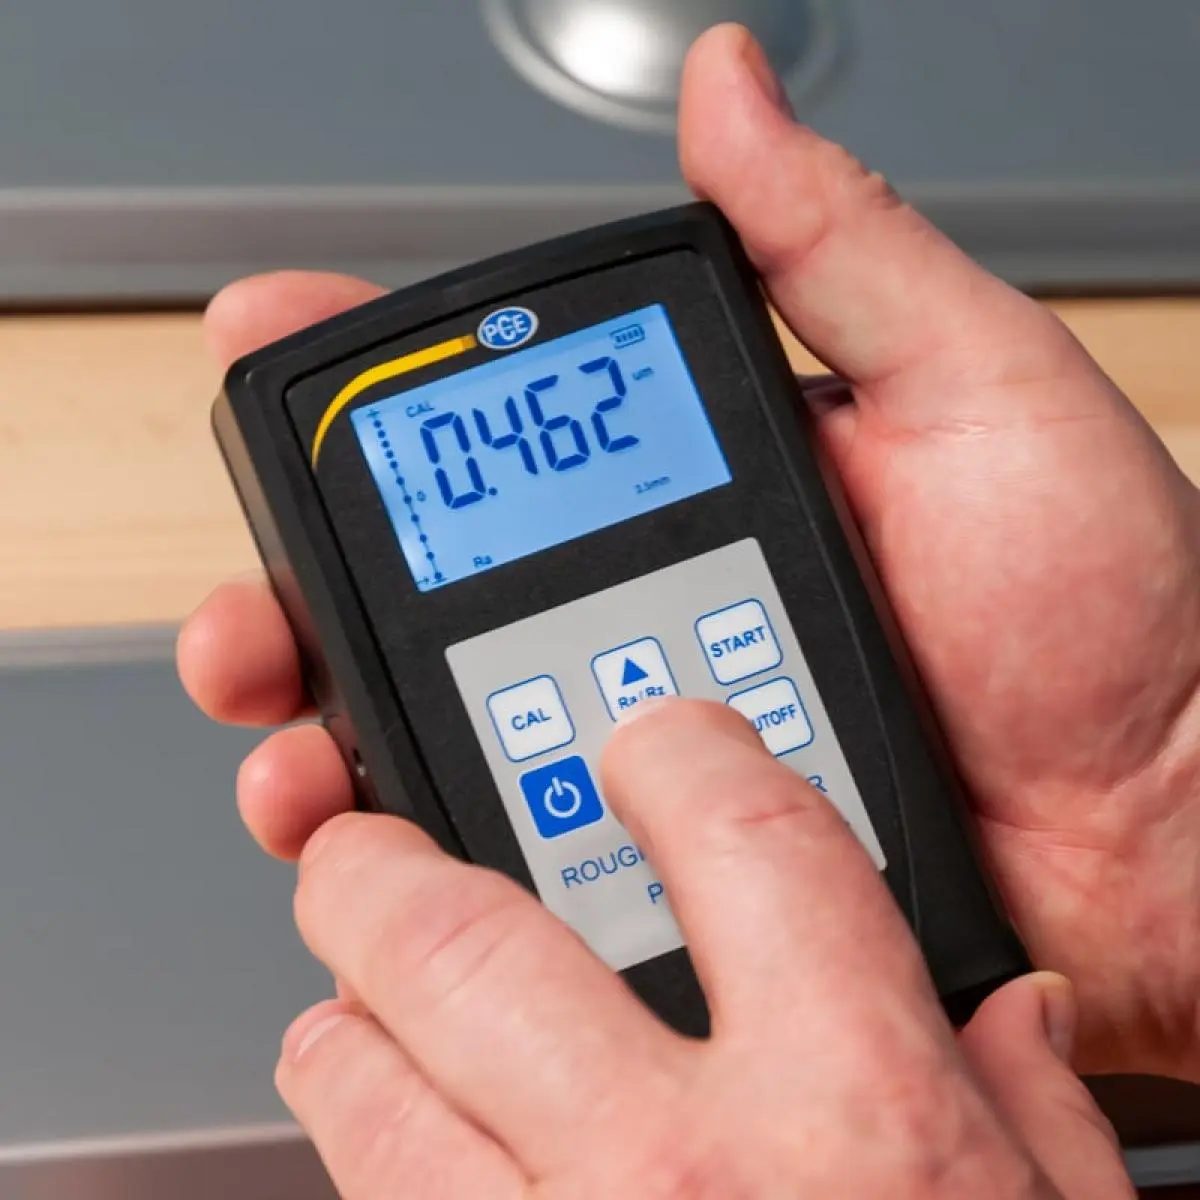
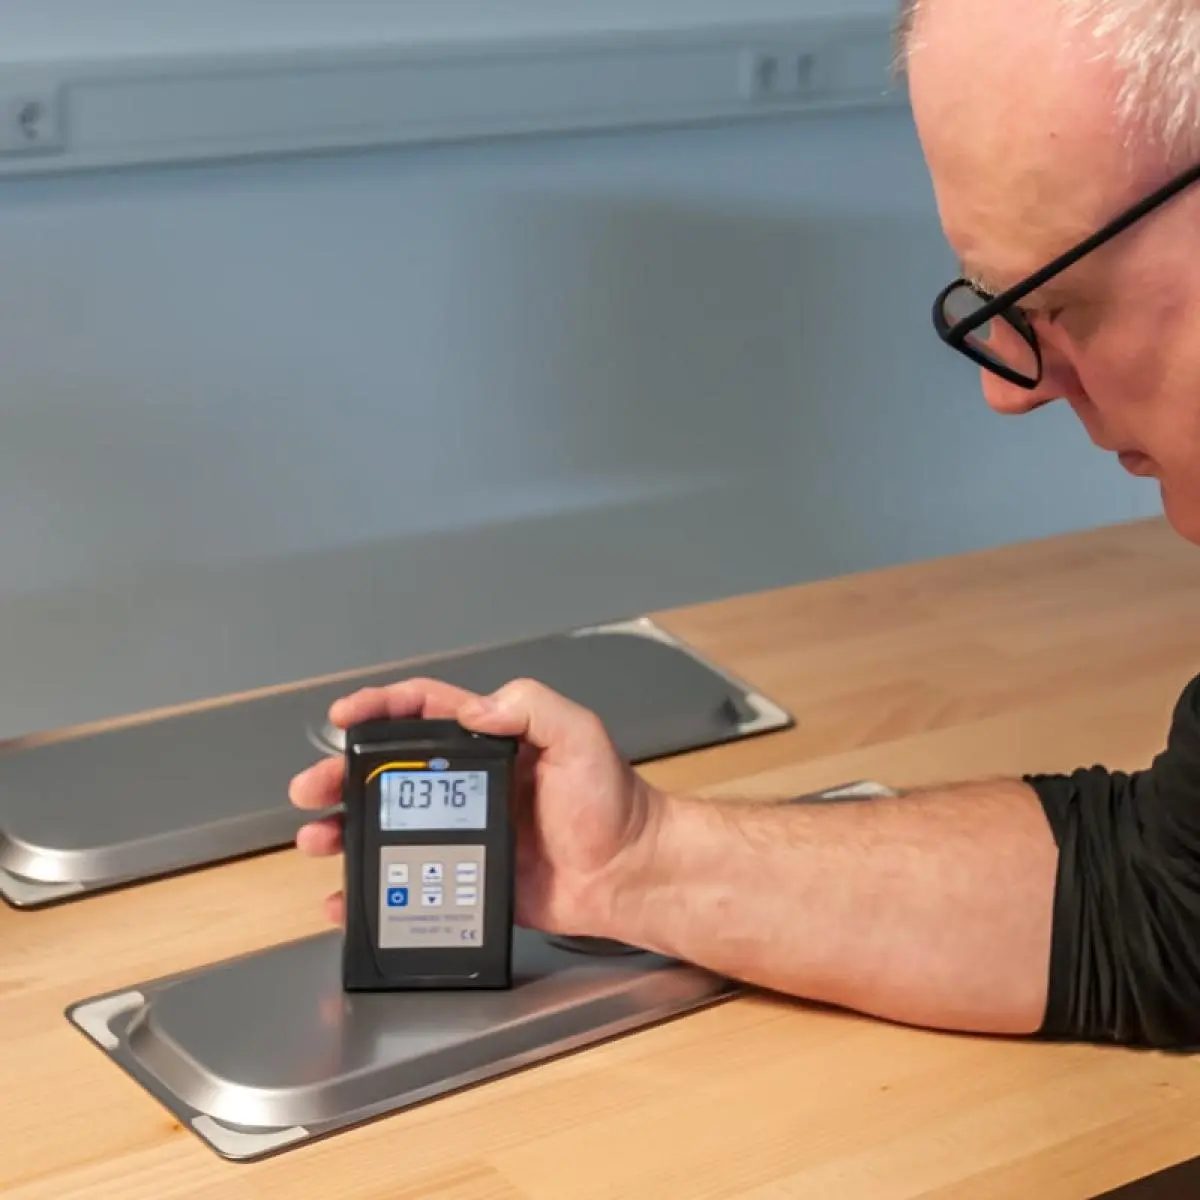
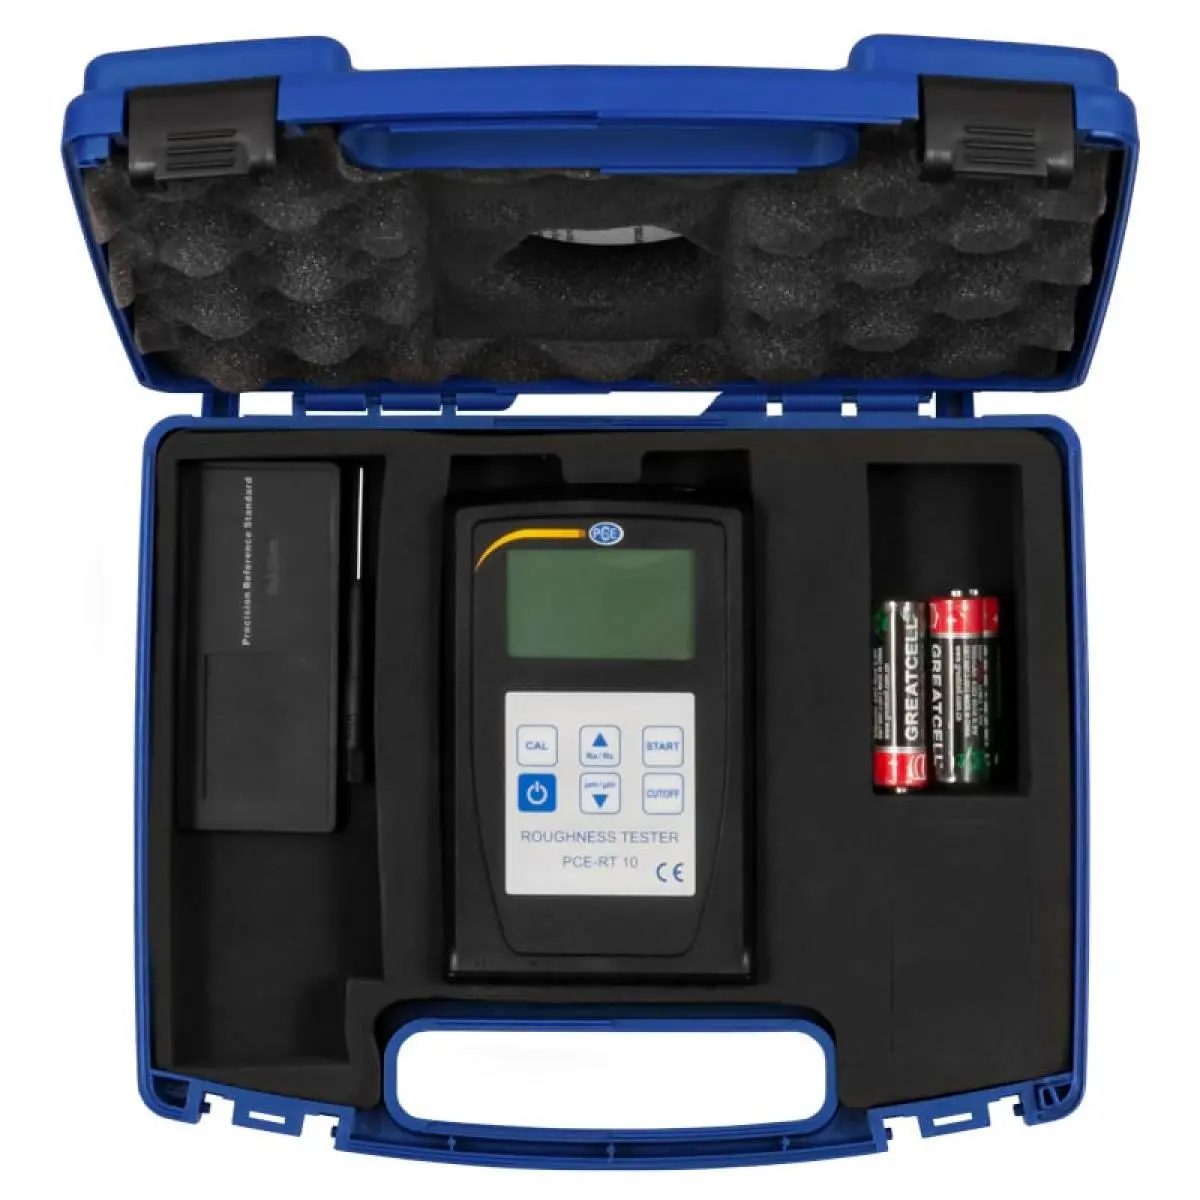

Hardness Tester PCE-RT 10
The measurement range covers Ra and Rz /
Highlights
– Inductive principle
– Backlit LCD screen
– Threshold function
– Easy to transport –
– Easy to use
– Diamond sensor
– The display shows slight fluctuations
Specifications
| Standards | GB/T 6062, ISO 4287, DIN 4768, JIS B, ANSI 46.1 |
| Screen | LCD |
| Parameters | Ra, Rz |
| Range | Ra: 0.05–10.00 µm Rz: 0.1–50.0 µm |
| Accuracy | ±15% |
| Fluctuation in the displayed value | 10% |
| Resolution | 0.001 / 0.01 / 0.1 |
| Sensor | |
| Probe tip radius | 10 µm |
| Probe tip material | Diamond |
| Probe measurement force | 16 mN (1.6 gf) |
| Probe angle | 90º |
| Vertical radius of the guide head | 48 mm |
| Maximum travel | 12.5 mm / 0.5 inches |
| Cutting length (l) | 0.25 mm, 0.8 mm, 2.5 mm |
| Vehicle speed | |
| Sampling | if Length = 0.25 mm, Vt = 0.135 mm/s |
| Sampling | if Length = 0.8 mm, Vt = 0.5 mm/s |
| Sampling | if Length = 2.5 mm, Vt = 1 mm/s |
| Return | Vt = 1 mm/s |
| Assessment Length | 1–2L Optional |
| Terms of Use | Temperature: 0–50 ºC Humidity: <80% RH |
| Power Source | 4 x 1.5 V AA (UM-3) batteries |
| Dimensions | 128 x 80 x 30 mm |
| Weight | 280 g |
Scope of Delivery
1 x accuracy standard
4 x 1.5 V AA batteries
1 x user manual
1 x carrying case
Surface roughness is an important parameter when determining whether a surface is suitable for a particular purpose. Rough surfaces often wear out faster than smooth ones. Rougher surfaces are generally more susceptible to corrosion and cracking, but they can also promote adhesion. A roughness meter is used to quickly and accurately determine a material’s surface texture or surface roughness. A roughness tester displays the measured roughness depth (Rz) as well as the average roughness value (Ra) in micrometers or microns (µm). Measuring surface roughness involves applying a roughness filter. Various international standards and specifications for surface texture or surface finish recommend the use of different roughness filters. For example, ISO standards often recommend the Gaussian filter.
The external shape of a surface or object is determined, among other things, by its basic shape as well as its waviness and roughness. Waviness and roughness describe relatively small deviations of a surface from the specified ideal contours of the corresponding shape. Roughness affects not only the appearance of surfaces but also the suitability of products for use. Rough surfaces are quite desirable for certain applications, such as preventing slipping. For this reason, sand is used on road surfaces in icy or snowy conditions, and floor coverings with rough surfaces are used in areas where an increased risk of slipping is expected. To achieve a specific level of roughness, components are often specially treated—for example, by grinding, polishing, etching, or coating. This allows the roughness to be specifically reduced or increased.
Standards for Describing and Measuring Surface Roughness
The two-dimensional surface finish of technical components is described, among other places, in the following standards:
| – DIN 4760 | Shape deviations, terminology, classification system | |
| – ISO 1302 (2002) | Geometric Product Specification (GPS) | – Specification of surface texture in the product’s technical documentation, |
| – ISO 4287 (1997) | Geometric Product Specification (GPS) | – Surface texture: pencil/profile method Requirements, |
| definitions and characteristics of surface texture, | ||
| – ISO 4288 (1996) | Geometric Product Specification (GPS) | – Surface texture: Pencil/profile |
| Method: Rules and Procedures for Evaluating Surface Texture, | ||
| – ISO 13565-(1996/98) | Geometric Product Specification (GPS) | – Surface texture: Pencil/profile |
| a method for surfaces with functionally significant properties similar to those of Plato, |
For claims regarding the three-dimensional texture of component surfaces, the standard ISO 25178 (2016), “Geometric Product Specification (GPS) – Surface Texture: Flat,” may be used. There are also industries that use the ANSI B 46.1 or JIS B 0601 standards.
Characteristic values for describing roughness measured along a line
Surface roughness is not usually described by a single characteristic value, but by several. Which characteristic values are important for your application depends, in most cases, on the surface finish and the intended use of the profile being tested.
R a Average roughness, arithmetic mean roughness
Average roughness is the calculated average of the absolute individual values of a measured section that deviate above or below the ideal profile line. Based on this value alone, no conclusions can be drawn regarding the maximum values or the distribution of heights and depths on the surface being tested. Average roughness is measured, for example, on sandblasted or polished surfaces.
R q Root mean square roughness value
The root mean square roughness value is determined by summing the square of the individual values, dividing by the number of individual values, and taking the square root of the result. This value is also called the root mean square (RMS) or the standard deviation of the individual measured distance.
R z average roughness depth
The roughness depth is the distance between the highest peak and the lowest valley of a single measurement section. The average roughness depth is determined from the individual values of five individual roughness depths measured consecutively on the line. This is done by adding the five values and dividing by five.
R z1max maximum roughness depth (peak and valley height)
The maximum peak-to-valley elevation of a total line consisting of five individual measured sections is the largest of the individually determined peak and valley elevations.
R t total height of the roughness profile
The total height of the roughness profile is the vertical distance between the upper and lower extreme values of the entire measurement section. The lowest valley and the highest peak may be located in different individual measurement sections.
Optical and Tactile Measurement Methods
Optical or tactile methods can be used to measure roughness. An optical roughness measuring device scans the surface of a component with light. The surface condition is determined by evaluating the reflected light beams. In tactile measurements, the tip of a cone-shaped probe is moved along a line across the surface being examined. The radius of the probe tip and the angle of the cone affect how much the probe tip is bent upward or downward in response to peaks and valleys. This means that the type of probe tip also determines how precisely a tactile roughness measuring device can detect peaks and valleys. For both optical and tactile measurements, the roughness tester performs numerous calculations to determine various roughness parameters.
Selection Criteria for Hardness Testing Equipment
The ISO 3274 (1998) standard, “Geometric Product Specification (GPS) — Surface texture: Profile method — Characteristics of contact stylus instruments” was developed to provide a uniform characterization of tactile measuring instruments. This standard defines the nominal values and basic characteristics of these instruments and allows for the assessment of the impact of a specific instrument’s specifications on measurement results.
Measurement Parameters and Ranges Depending on which roughness parameters are to be measured, there are more or fewer instrument models to choose from. Another important specification is the measurement range within which the roughness measuring instrument can determine the respective parameter. Many types of devices are capable of determining the parameters Rz, Rt, Ra, and Rq. For example, the measurement ranges of individual devices can vary significantly
| Measurement range Rz, Rt | 0.1 … 50 μm or | 0.02 … 200 μm or | 0.02 … 320 μm |
| Measurement range for Ra and Rq | 0.05 … 10 μm or | 0.005 … 16 μm or | 0.005 … 32 μm |
Models are also available that display the parameters Rsm, Rsk, Rp, Rv, and Rc, as well as those whose measurements are characterized by the following values:
– Rmax, R3z, R3zmax, Rz1max, Rmr(c), Rdc, and Rmr
– Ry(JIS)/Rz(JIS),
– Rp(ASME), Rpm(ASME), Rv(ASME)
or some others, such as Rku, Mr1, and Mr2, can be specified.
Shape of the scanning needle
The shape of the scanning needle is one of the factors that determines how detailed the measurement results are. The general dimensions are:
Scanning spot radius: 2 μm / 5 μm / 10 μm
; Cone angle: 60° / 90°
Measurement distance, measurement filter on the roughness meter
For many devices, the length of a single measurement segment can be set to 0.25 mm, 0.8 mm, or 2.5 mm. For the total measuring distance, you can select a factor of four, three, two, or one, which differ from the five-fold individual distance specified in the standard. For some devices, the total detection distance—including pre- and post-travel—is limited to 6 mm, so it is not possible to measure five times 2.5 mm with these devices.
Filtering of measured values, with the aim of distinguishing between waviness and roughness, can be performed using various methods. A roughness measuring device intended for demanding measurement tasks should allow the user to configure the necessary filter. Some devices offer various filtering methods, such as a Gaussian filter, an RC filter, a PC-RC filter, and a DP filter.
Accuracy
As with any measuring instrument, attention should also be paid to the measurement accuracy of a roughness measuring device. The measurement accuracy of many devices is 10 percent or 15 percent, while their reproducibility is, for example, 6, 10, or 12 percent. Accuracy can be verified through calibration, i.e., by measuring test specimens of known roughness under specified conditions.
Display and control panel
There are significant differences between the different models in terms of both display and control panel. The choice ranges from a device with a few keys and a display showing only the characteristic value and some additional information, to a touch screen with a graphical display of the measured surface profile. It is also important to ensure that the roughness measuring device is easy to operate and read in the laboratory or production environment.
Memory, Interfaces, and Software
For many applications, it is helpful to be able to save measurement data to the hardness tester or transfer it directly to another device. Available data interfaces include RS232, micro-USB, and Bluetooth. For some models, specialized software is available that significantly simplifies the evaluation and storage of measurement data.
Advantages of Bluetooth in a hardness measuring device
If the hardness measuring device is equipped with a Bluetooth interface, the measured values can be transmitted directly to a mobile device and conveniently evaluated, saved and transferred to this device using an app. Another advantage of a touch-sensitive hardness meter for some measurements is that the parameters can be set via the corresponding app and the measurement can even be started via the app. This ensures that the scanning needle does not move from the starting point or deviate due to the applied vibration.
Calibration of a Tactile Roughness Tester
ISO 12179 (2000) “Geometric Product Specification (GPS) — Surface texture: Method for measuring tactile roughness — Calibration of tactile roughness profilometers” describes how to verify the accuracy of the instruments. Many devices can not only be calibrated, but if the deviations found during calibration are too large, they can also be adjusted. Make sure that the roughness tester you intend to use offers this feature. Some models come equipped with a roughness standard and a suitable calibration pad so that the user can calibrate the instrument themselves if necessary .